Draw with Data: Custom Dataviz Using D3 | VizChitra 2026
If you know your shapes, you too can make bespoke dataviz with D3!
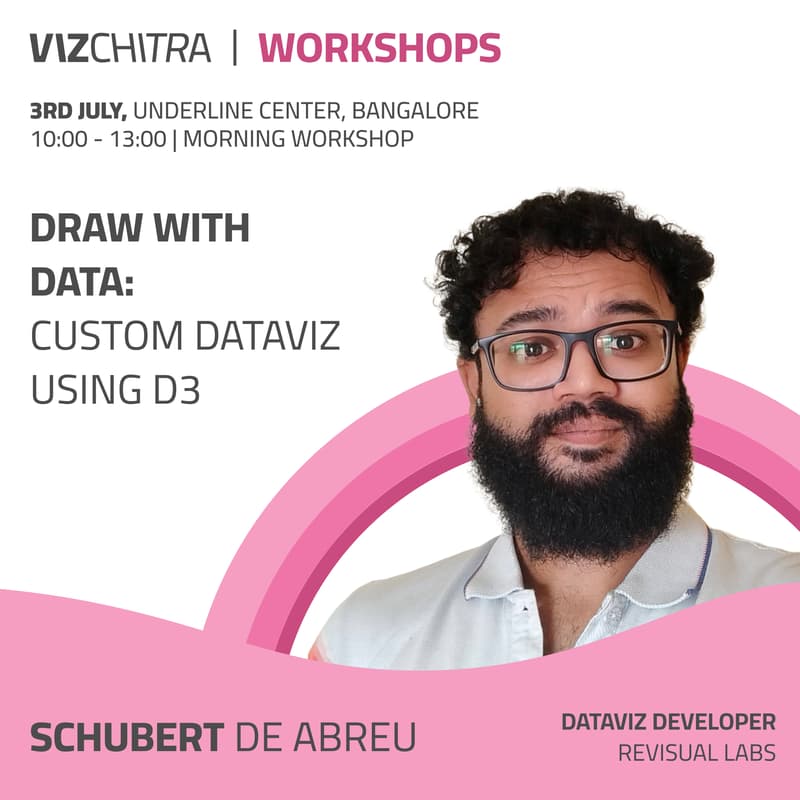
Register for the Draw with Data: Custom Dataviz Using D3 workshop at VizChitra 2026!
About the workshop
Have you ever hit the limits of chart plugins and wanted to draw exactly what you imagine? This workshop shows how to build charts directly in code. Instead of moving between tools, you will break charts into simple shapes, map data to SVG elements and let D3 handle the math and layout, while Svelte helps assemble interactive, responsive views. You will move from basic bars and scatter plots to more custom chart ideas through clear, hands-on examples.
This workshop is designed for designers, creatives and visual storytellers who are curious about custom dataviz but do not want a full web development course. You will pick up enough HTML, CSS and JavaScript to keep experimenting beyond the session, with no prior coding experience required. The workshop is conducted by Schubert de Abreu, an award winning data visualisation developer at Revisual Labs who uses D3 and Svelte in his everyday projects.
About the instructor
Schubert is a frontend and dataviz developer at Revisual Labs. He spends much of his time building charts, scrollytelling pieces and interactives on the web. His work was among the winners of last year's Pudding Cup. He enjoys experimenting with design, motion and interaction to bring data and stories to life. Outside of work, you can find him on the losing side of a daily sketching habit.
About VizChitra
VizChitra is India’s premier data visualisation community and conference, bringing together designers, journalists, researchers, developers and the simply-curious to explore how data, design and narrative meet in work and everyday life.
Learn more
Check out the VizChitra 2026 conference in Bangalore on 3–4 July here: https://vizchitra.com/2026/ ↗
Buy a ticket to the conference and other workshops here: https://tickets.vizchitra.com/ ↗