
Control Charts & Capability in an Hour or Less
Control Charts & Capability in an Hour or Less
You have process data, and you want to know if the process is stable and if it can meet spec. In one live hour, we'll take you from raw measurements to clear, defensible answers.
Using the Operation Improvement metric dashboard (https://metricdashboard.operationimprovement.com/), we'll work through real examples together:
Control charts: pick the right chart, read the limits, and tell common-cause noise from a real signal.
Out-of-control rules: know what's worth reacting to and what's just tampering.
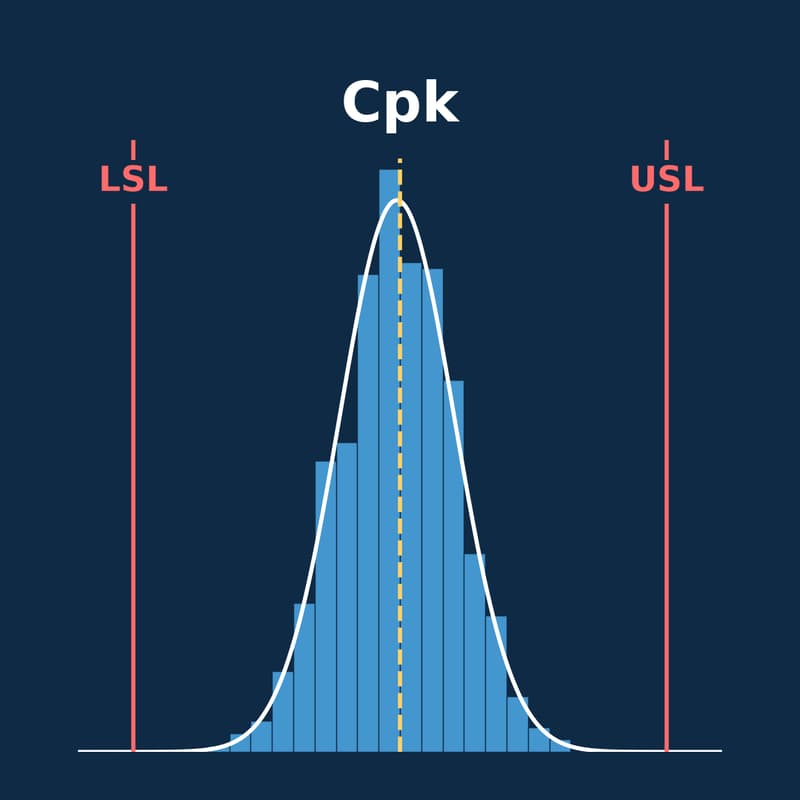
Capability (Cp, Cpk): check whether a stable process can actually hold your spec, and what to fix first if it can't.
Turning results into decisions: what to show your team or customer, and in what order.
Who it's for: quality and process engineers, supervisors, plant managers and owners who need quick, practical SPC without the stats lecture.
What you need: a laptop with a browser and Zoom. Bring a small data set if you'd like, or use ours.
Format: 60 minutes live on Zoom, with hands-on work in the dashboard and time for Q&A.
Enrollment: $79 per person. The session runs once 4 people are enrolled. If we don't reach 4 by the registration deadline, you'll get a full refund.
Operation Improvement Inc: Better Decisions, Better Products & Lower Costs!