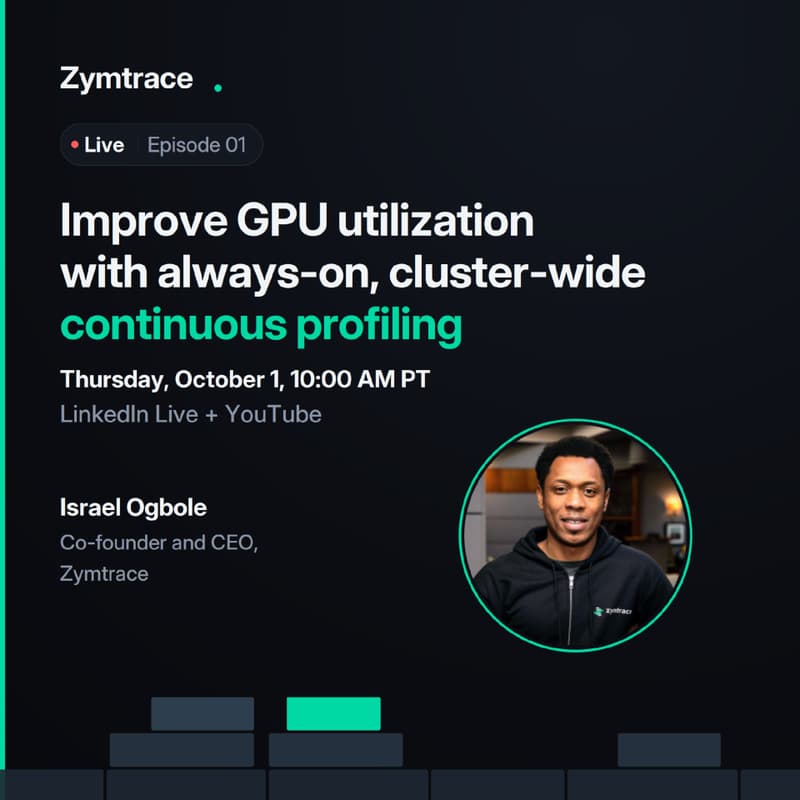
Improve GPU utilization with always-on, cluster-wide, continuous profiling
Most GPU clusters run well under half utilization, and the reason is usually invisible: the GPU is waiting on the CPU, and nothing in your stack shows you where.
Join Zymtrace co-founder and CEO Israel Ogbole for a live session on finding the bottlenecks that keep GPU utilization low, using always-on, cluster-wide, continuous profiling. No code changes, no recompilation, no instrumentation.
This is a live product walkthrough, not a slide deck. You will see:
How to spot the CPU bottlenecks that starve GPU workloads
How to read a CPU-to-GPU flamegraph in production, from Python frames down to CUDA kernels and stall reasons
How teams turn profiling data into throughput per GPU, per dollar, per watt
We will close with live Q&A. Bring your hardest questions about your own workloads.
Thursday, October 1, 10:00 AM PT. 40 minutes, streamed on LinkedIn Live and YouTube.
Zymtrace is built by the team that created and donated the eBPF profiler to OpenTelemetry.