Presented by
Meta Developer Communities
147 Went
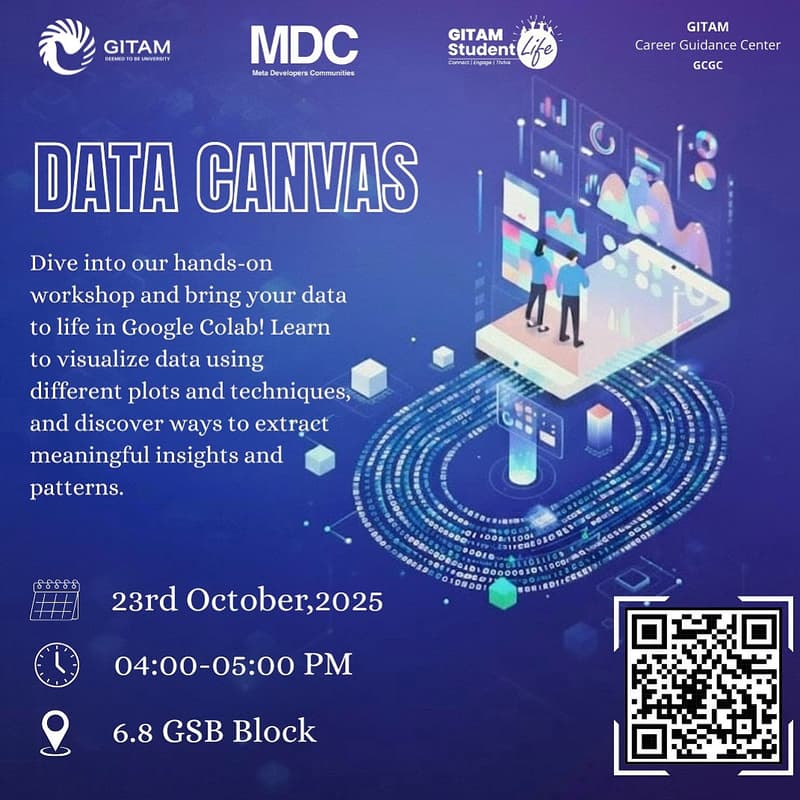
Data Canvas
About Event
This hands-on workshop invites participants to explore and visualize data using simple coding techniques in a Google Colab notebook. Teams or individuals will be provided with a clean dataset and guided instructions to plot different types of graphs like bar, pie, line, and scatter plots using single-line commands (e.g, bar.xyz). Participants will also learn to modify graph parameters such as axes, colors, and labels to personalize their visualizations. The event emphasizes creativity and clarity in presenting data, turning raw numbers into impactful visual stories.
Location
6.8 MBA Classroom, GSB Block, GITAM
Presented by
Meta Developer Communities
147 Went