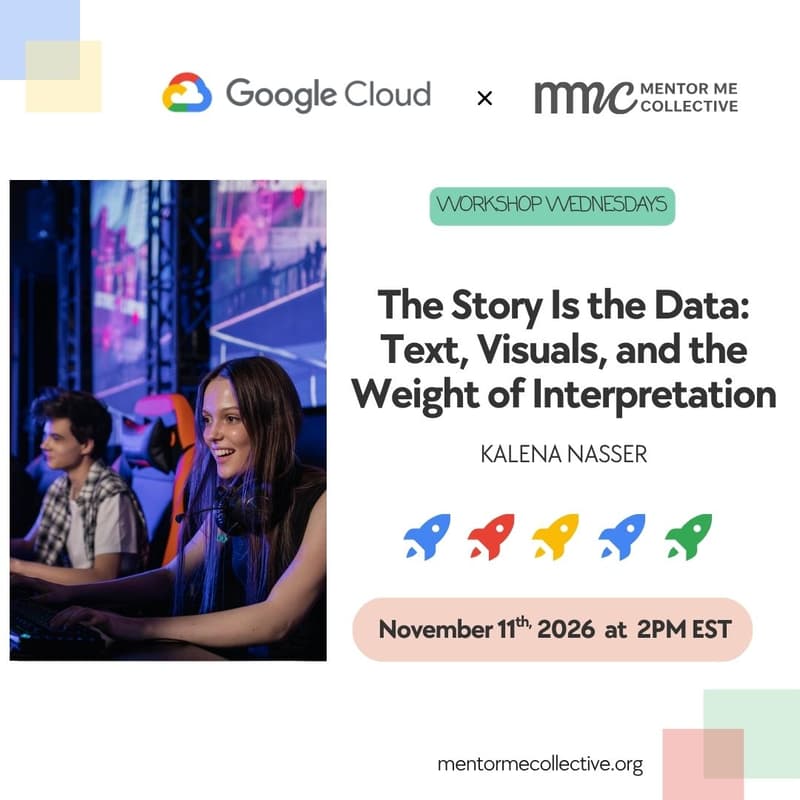

The Story Is the Data: Text, Visuals, and the Weight of Interpretation
Welcome to Workshop Wednesday, hosted by the Mentor Me Collective! 🚀
In this high-energy masterclass, we are joined by Khalena Nasser, Business Intelligence Professional and Data Science Master’s Student, to help you bridge the gap between raw numbers and compelling, truthful narratives in data analytics.
Today’s Topic: The Story Is the Data: Text, Visuals, and the Weight of Interpretation
Why does the exact same dataset tell two completely different stories depending on who is holding the pen? Designed specifically for data analysts, business intelligence professionals, and anyone who builds reports with data, this workshop explores how charts, text, and visual choices shape decision-making. Learn how to navigate the subtle line where visuals either sharpen an insight or quietly distort reality—especially in an era where AI is increasingly crafting automated data narratives.
If you find value in this session, make sure to Like, Comment, and Subscribe for more weekly workshops and mentorship content!
🎙️ Meet the Speaker: Khalena Nasser
Khalena Nasser is a Business Intelligence professional with 6 years of industry experience across global sectors including FMCG, tobacco, and the wind energy industry. Currently pursuing an MSc in Business Intelligence & Data Science in Hamburg, Germany, Khalena focuses on integrating advanced analytics and AI into real-world business strategy. Her work centers on turning complex data into clear, actionable, and honest stories that drive business impact.
🛠️ The Workshop Tool Kit
Learn how to apply data visualization principles and narrative framework analysis:
The Data vs. Insight Framework (Understanding the critical distinction between raw data, structured information, and actionable insight)
Visual Perception Analysis (Evaluating how readers interpret charts, graphs, and visual weight)
Ethical Narrative Design (Ensuring AI-driven and manual reporting remain truthful to the underlying data)
💡 Key Takeaways:
Narrative Interpretation: Understand why identical datasets lead to conflicting conclusions based on visual choices.
Effective Visual Storytelling: Learn when text and charts sharpen decision-making versus when they create unintended distortion.
AI & Data Integrity: Stay mindful of how automated tools and AI generate data stories without losing narrative accuracy.
🤝 Connect with Khalena: 💼 Khalena’s LinkedIn: khalenanassers 📧 Email: khalenanassers@gmail.com
#WorkshopWednesday #MentorMeCollective #DataScience #BusinessIntelligence #DataVisualization #DataAnalytics #TechMentorship #DataStorytelling #Analytics #CareerInTech #DataEthics