Fooled by beautiful data – bias and data visualization
This roundtable discussion will explore how data vis can reveal hidden bias, but could also be a source of bias itself. The panel is drawn from a wide range of specialists, to give a fascinating perspective on both human and non-human data.
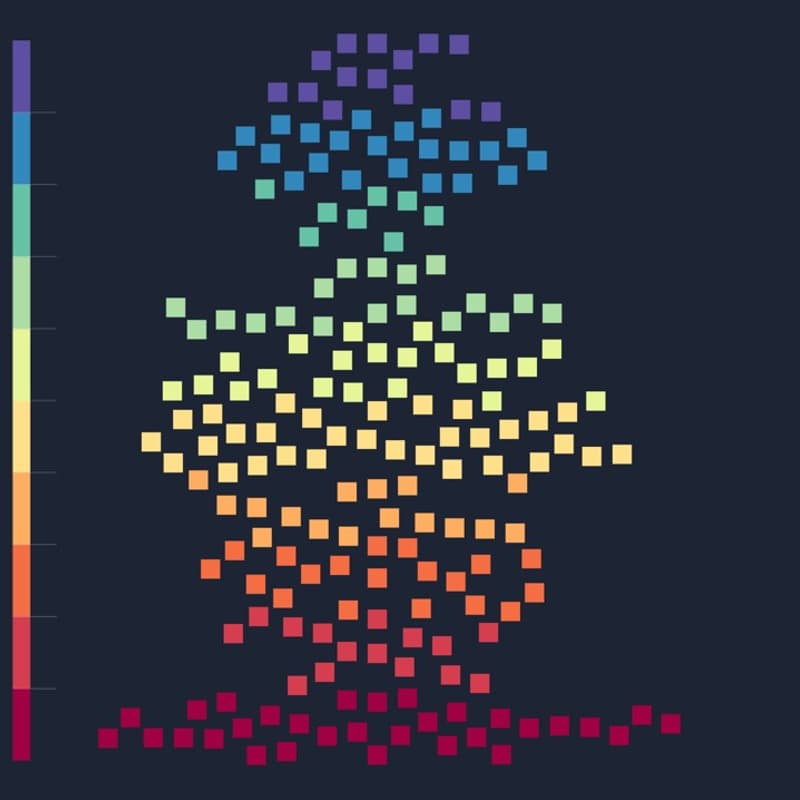
Image courtesy of Beth Taylor, PhD in Data Visualization doctoral candidate, City St George's.
The panel -
Professor Stephanie Wilson (moderator) - Stephanie is Professor of Human-Computer Interaction and Co-Director of the Centre for Human-computer Interaction Design, a specialist research centre in the Department of Computer Science at City St George’s. Her research focuses on inclusive interaction design and data visualization, co-design and innovative digital technologies for healthcare.
Dr Narges Mahyar – a Senior Lecturer in Computer Science at City St George’s, University of London, and a 2024–2025 Harvard Radcliffe Fellow. She develops human-centered visualization systems that help people make sense of complex data, communicate uncertainty, and participate more meaningfully in decisions that affect their lives.
Dr Sara Heitlinger – a Reader in Computer Science at City St George’s, University of London where she co-directs the Centre for Human-computer Interaction Design. She is interested in what “more-than-human” data visualization could be, where we use and communicate data to support the wellbeing of humans and other species in the city.
Ana Marques – a multidisciplinary designer and PhD student in Diverse CDT, Ana has extensive experience in higher education and academic settings, and a background in graphic design and illustration. She is passionate about finding ways to humanise data visualization practices and outputs using design thinking, storytelling and multimedia, among other creative tools.