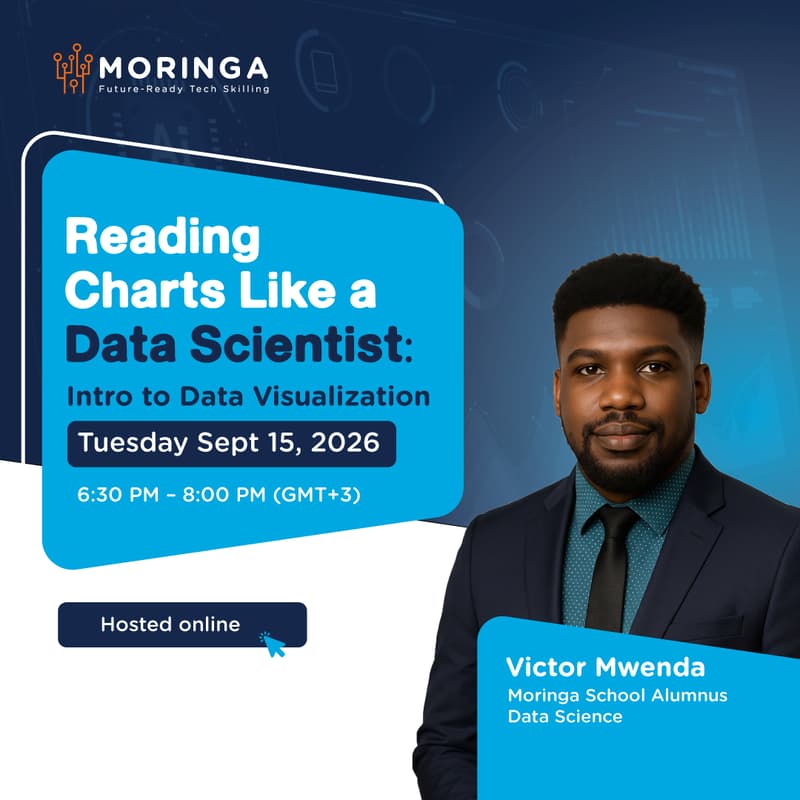

Reading Charts Like a Data Scientist: Intro to Data Visualization
Reading Charts Like a Data Scientist: Intro to Data Visualization
Most people look at a chart and see a picture. Data scientists look at the same chart and see a story, a warning, or a decision waiting to happen.
This beginner-friendly session teaches you how to actually read data visualizations the way professionals do — spotting what's being emphasized, what's being hidden, and what the numbers are really saying. You'll also learn the fundamentals of creating visualizations that communicate clearly instead of confusing your audience.
Whether you're trying to make sense of dashboards at work or want to start building your own, this session gives you the lens to see data differently.
What you'll cover:
How to critically read charts, graphs, and dashboards
Common visualization techniques — and where they go wrong
Choosing the right chart type for the story you're telling
Practical principles for creating clear, honest visualizations
Who should attend:
Students, professionals, and anyone who works with data and wants to interpret — and eventually create — visuals that actually communicate.
📅 Tuesday, September 15
💻 Online