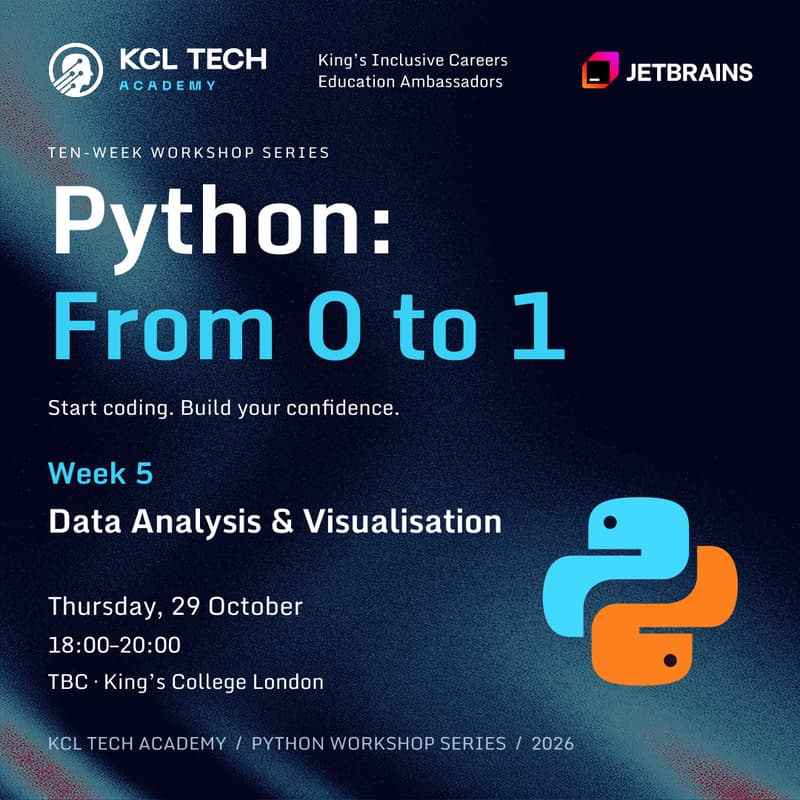

Python 0-1, Week 5: Data Analysis & Visualisation
The fifth week of Python 0-1 is here!
Delivered in partnership with King’s Inclusive Careers Ambassadors and JetBrains.
Open to all university students, whatever you study. Completely beginner-friendly. No coding experience needed!
Learn to work with numbers and generating visual graphs using code.
💻 What you’ll learn
Utilise
forloops and variables to calculate total, minimum, maximum and average of large datasetsCode using the
matplotliblibrary, directly in PyCharmConverting lines of raw text from a CSV file into clean Python lists.
By the end, you’ll create programs to turn large amounts of data into useful statistics!
📅 Thursday, 29 October
🕔 6-8pm
📍 TBC
🎒 Bring your laptop
Start coding. Build your confidence.
Spaces are first come, first served, so register as soon as possible.