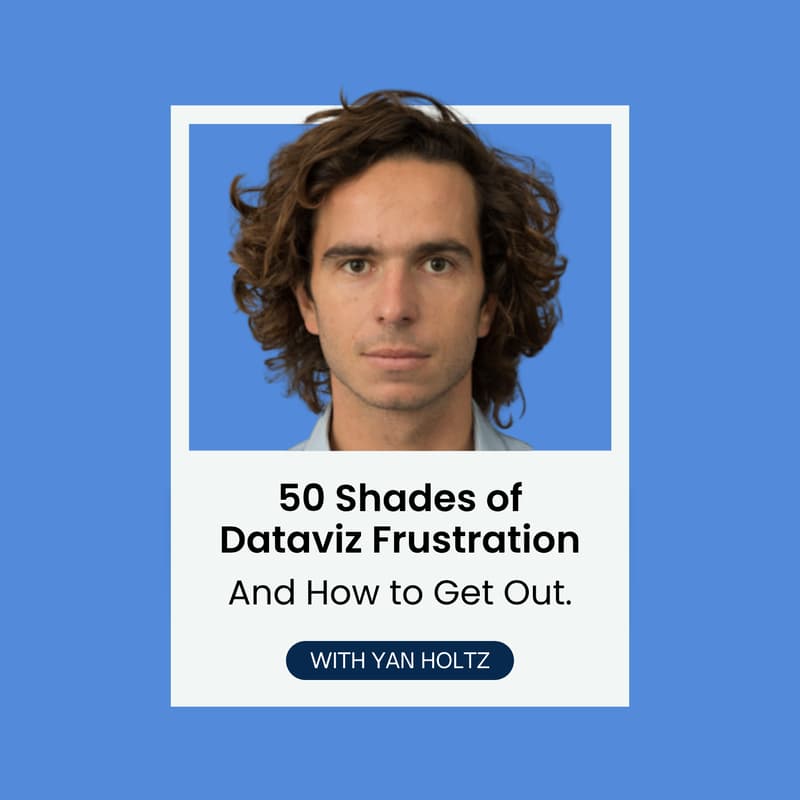
50 Shades of Dataviz Frustration. And How to Get Out.
What if you could describe the chart of your dreams, and then build it in no time?
Yan will show you how.
After years working in the dataviz field, Yan has seen frustration in every corner of the profession. Each one has its own flavor.
The designer wants to see her chart come alive.
The Excel user wants better design and customization.
The Tableau/PowerBI user wants a chart type that isn't in the menu. The ggplot2/Python user wants interaction.
The Shiny/Streamlit developer wants a transition that doesn't blink.
The D3 developer is tired of writing 300 lines for a simple chart.
In this talk, Yan will review the main kinds of frustration, then demo an AI tech stack that solves them all.
RSVP now to add the talk to your calendar.
Format
30 mins teaching followed by live Q&A
Replay shared with registrants
About Yan
Yan Holtz is a software engineer and data analyst focused on data visualization. He created widely used educational websites such as Data to Viz; the Graph Galleries for R, Python, and D3; and Dataviz Inspiration.
Note: By registering, you agree to receive emails from the hosts, including event reminders. Unsubscribe anytime.