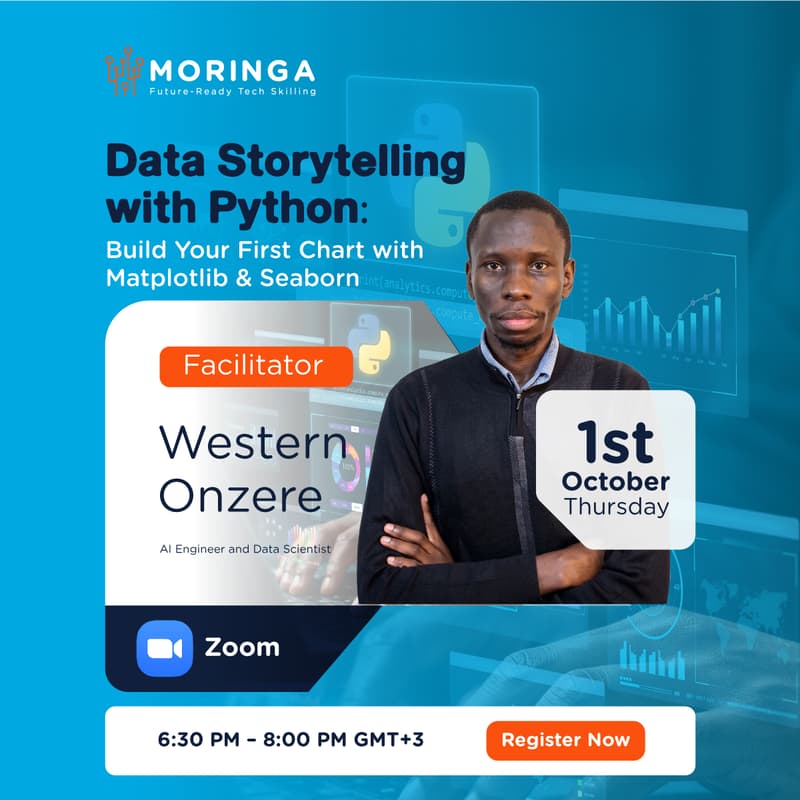

Data Storytelling with Python: Build Your First Chart with Matplotlib & Seaborn
Here's the Luma brief, ready to paste:
Title: Data Storytelling with Python: Build Your First Chart with Matplotlib & Seaborn
Alternative title: From Raw Data to a Clear Story: Your First Python Charts
Description
Anyone can make a chart. Making one that people understand, remember and act on is a different skill.
In this hands-on masterclass, you'll learn the basics of data storytelling with Python. You'll go from a raw dataset to clear, well-designed charts using two of the most popular visualisation libraries, Matplotlib and Seaborn. You'll also learn why some charts work and others don't, and how to pick the right visual for the point you want to make.
The session is beginner-friendly and practical. You'll leave with working code and a chart you built yourself.
What you'll learn
How to turn a question into the right chart: bar, line, scatter or distribution
How to build and customise your first plots with Matplotlib
How to use Seaborn to make clean, publication-ready visuals quickly
How to use titles, labels, colour and annotations to guide your audience to the insight
Common mistakes that make charts misleading or confusing, and how to avoid them
Who should attend
Aspiring data analysts and data scientists starting out with Python
Students and bootcamp learners who want to present their projects better
Professionals who work with spreadsheets and reports and want to level up
Anyone curious about turning numbers into stories people care about
What to bring: A laptop with Python installed, or a free Google Colab account. No prior visualisation experience is needed. Basic Python familiarity helps.
About the Speaker
Western Onzere, AI Engineer & Data Scientist
Western builds production-ready data, machine learning and AI systems. His work covers data analytics, machine learning, MLOps, retrieval-augmented generation (RAG) and agentic AI. He has built solutions for risk analytics, forecasting, business intelligence, intelligent search and AI-powered applications.
He cares about reliable systems that connect data, engineering and business needs, and that work in the real world, not just in experiments. He's also passionate about helping upcoming data professionals build strong technical foundations and learn to communicate insights clearly.