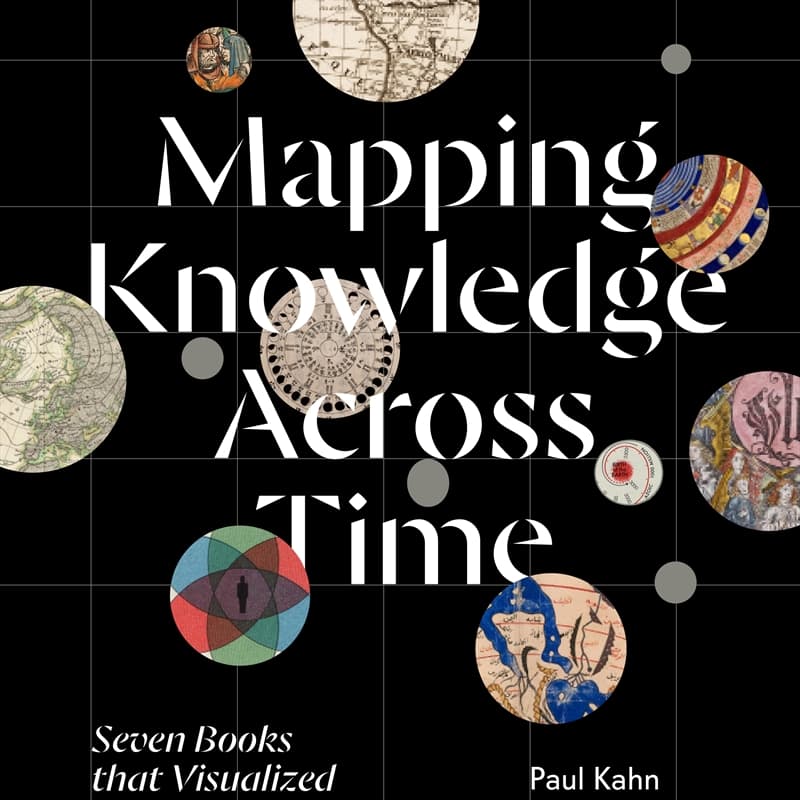

Data Viz DC: Mapping Knowledge Across Time, Seven Books that Visualized the World - Paul Kahn
Data Visualization DC + Data Science DC joint meetup.
Agenda:
5:30 - Doors
5:30 - 6:15: Food & Socializing
6:15 - 6:30: Introductions
6:30 - 8:00: Mapping Knowledge Across Time, Seven Books that Visualized the World - Paul Kahn
If you're interested in the intersection of Data Science, Visual Design, UI/UX, Art, Psychology, and Business Intelligence, this event is for you!
Talk:
What patterns do we see when we place books that visualize the world side by side? Information Design author Paul Kahn answers this question with an informative and entertaining tour of seven extraordinary masterpieces, dating from the 12th to the 20th centuries. These Arabic, Catalan, Latin, German, Chinese, French, and English books present design systems that we can learn from. The conversation between their maps, diagrams and illustrations destabilizes the boundaries of art history and graphic design, shining a new light on the visualization patterns we use in the digital world today.
Speaker Bio:
Paul Kahn’s engagement with visualization of large knowledge structures began with hypertext research projects in the 1980s and continued with the development of diagram techniques for describing information architecture. He taught Information Design History at Northeastern University’s Information Design & Data Visualization program. He currently teaches at L'Ecole de Design Nantes Atlantique and co-hosts the Visualizing Complexity Science Workshop in Vienna. Paul created the first agency in France focused on information architecture, preceded by a decade leading Dynamic Diagrams in Providence RI, and led UX projects as Experience Design Director at Mad*Pow. During and after the pandemic, he developed and wrote about the Covid-19 Online Visualization Collection (COVIC). His essays about information design and data visualization appear in Nightingale and EYE Magazine. See his Timeline for details.
---
Data Viz DC is a program of Data Community DC. Learn more at www.dc2.org